
Srikar Devarapalli
Resume Contact

1 of 8

Eight years, three organisations

  1. 2018 – 2021

    Indian Political Action CommitteeData Analyst / Senior Data Analyst
  2. 2021 – 2025

    ITP Software Pvt LtdData & Technology Manager
  3. 2025 – now

    G3ODisha AnalyticsData Intelligence & Technology Lead
Srikar Devarapalli, smiling and looking to one side
Now at G3ODisha Analytics

I build data products from end to end, and I lead the team that ships them.

Scrapers and pipelines to collect the data, apps, dashboards and AI agents to use it, and reports people act on. I have done it for election campaigns, for news and media websites, and now for CinemaIP, an IMDb-style website for Indian movies built around live box-office data.

Claude Certified Developer – FoundationsFoundations · Anthropic · Oct 2026Verify on Credly ↗
  1. Mar 2025 – nowNow

    G3ODisha Analytics

    Data Intelligence & Technology Lead

    • Team of 9
    • Reports to the President and MD
    • CinemaIP's live box-office engine: 38K+ shows a day across 1,450+ cities in India, plus Indian films in the USA and the UAE, refreshed every hour.
    • The reports, trailers, news drafts, recommendations and producers' dashboard that all read from that one engine.
    • Political intelligence for G3ODisha's clients: VPAS booth scores from 27 KPIs, dashboards for all 119 Telangana constituencies, and leader and party social reports.
  2. Jun 2021 – Feb 2025

    ITP Software Pvt Ltd

    Data & Technology Manager

    • Managed three teams
    • Data, SEO and product (developers)
    • Election analytics: Form 20 read from images with OCR, and three surveys, one at state level and two at constituency level. All three forecasts were correct.
    • A social listening tool for leader and constituency reports, plus party apps and websites.
    • Two party websites and three news sites, two of them funded by the Google News Initiative, and six YouTube channels: two main channels with 1M+ subscribers each, plus their sub-channels.
  3. Apr 2018 – May 2021

    Indian Political Action Committee (I-PAC)

    Data Analyst / Senior Data Analyst

    • A real-time social media pipeline that scraped, processed and classified sentiment.
    • Leader and party profiles, follower engagement analysis and conversion forecasts.
    • Booth-level election analysis for Andhra Pradesh, Delhi, Tamil Nadu and West Bengal, and a state party's app with 100K+ downloads and 43% daily retention.
Srikar Devarapalli, smiling and looking to one side

I build data products from end to end, and I lead the team that ships them.

Scrapers and pipelines to collect the data, apps, dashboards and AI agents to use it, and reports people act on. I have done it for election campaigns, for news and media websites, and now for CinemaIP, an IMDb-style website for Indian movies built around live box-office data.

Now at G3ODisha Analytics

Claude Certified Developer – FoundationsFoundations · Anthropic · Oct 2026Verify on Credly ↗
  1. Mar 2025 – now

    G3ODisha Analytics

    Data Intelligence & Technology Lead

    • Team of 9
    • Reports to the President and MD
    • CinemaIP's live box-office engine: 38K+ shows a day across 1,450+ cities in India, plus Indian films in the USA and the UAE, refreshed every hour.
    • The reports, trailers, news drafts, recommendations and producers' dashboard that all read from that one engine.
    • Political intelligence for G3ODisha's clients: VPAS booth scores from 27 KPIs, dashboards for all 119 Telangana constituencies, and leader and party social reports.
  2. Jun 2021 – Feb 2025

    ITP Software Pvt Ltd

    Data & Technology Manager

    • Managed three teams
    • Data, SEO and product (developers)
    • Election analytics: Form 20 read from images with OCR, and three surveys, one at state level and two at constituency level. All three forecasts were correct.
    • A social listening tool for leader and constituency reports, plus party apps and websites.
    • Two party websites and three news sites, two of them funded by the Google News Initiative, and six YouTube channels: two main channels with 1M+ subscribers each, plus their sub-channels.
  3. Apr 2018 – May 2021

    Indian Political Action Committee (I-PAC)

    Data Analyst / Senior Data Analyst

    • A real-time social media pipeline that scraped, processed and classified sentiment.
    • Leader and party profiles, follower engagement analysis and conversion forecasts.
    • Booth-level election analysis for Andhra Pradesh, Delhi, Tamil Nadu and West Bengal, and a state party's app with 100K+ downloads and 43% daily retention.

How I run the work

The habits behind the pipelines.

01

Documented

Requirements documents, API docs and client handover packages, maintained alongside the build.

02

Client data kept apart

Client data is kept apart from development, and credentials stay out of code.

03

Scheduled and monitored

Collection jobs run on a schedule on Google Cloud VMs. Health checks flag any source or machine that stops reporting, so gaps are noticed early.

04

Findings first

Every report opens with its main finding, then the numbers and charts, benchmarked against peers.

EducationIIT (BHU) VaranasiB.Tech, 2013 – 2017

2 of 8

Entertainment: the data engine behind CinemaIP

Show-level box office from across India, plus Indian films in the USA and the UAE, collected every hour and turned into live pages, reports and paid analysis.

Hourly
box-office refresh
38K+
shows a day, across 1,450+ Indian cities
Seat-level
availability in Indian theatres
USA · UAE
Indian films tracked abroad

More in Entertainment

  • Movie recommendation engineLive on cinemaip.ai. A couple of mood questions, then films to match, for people who cannot decide what to watch.
  • Trailer & teaser pipelineFinds, validates and logs trailers and teasers for new releases, daily.
  • News generationSuggests data-led news stories from box-office data with Gemini, served through an API.

2 of 8

Entertainment: the data engine behind CinemaIP

Show-level box office from across India, plus Indian films in the USA and the UAE, collected every hour and turned into live pages, reports and paid analysis.

01 03

Box-Office Collection Engine

Show-level box office lives across ticketing platforms. India is covered city by city; the USA and the UAE are tracked for Indian films. The job: collect it every hour and publish it.

India
38K+ shows a day across 1,450+ cities
USA · UAE
Indian films. The US is being extended to all US films and box office.
Per show
Shows, tickets, occupancy, average ticket
  • Scheduled jobs on Google Cloud VMs split the theatre list across machines, so each carries a slice of the work.
  • Preprocessing de-duplicates, fixes shapes and validates before anything is trusted.
  • Health checks flag a source or machine that stopped reporting, so gaps are noticed early.
  • Cleaned data syncs into the database the product reads, feeding live movie pages and the reports engine.

Data collection · Automation · Scheduling & monitoring · Cloud VMs & batch · Python · SQL · Data wrangling · Web scraping · Cloud SQL

See the live Box Office

02 03

Reports Engine

Finished, findings-first reports at three levels of the market: one film, one theatre, and the whole industry.

3
Report types
₹4,468 Cr
Gross covered by one industry report
4,429 cinemas
In that industry report
  • One engine, three report types: a film's whole run, a single theatre's month, and an industry quarter.
  • Built on the same hourly collected data, so every figure traces back to shows, tickets and cities.
  • Each report is a shareable web page with a PDF download. The public samples are live on CinemaIP.
  • A new film, theatre or quarter is another run of the same engine, not a new project.

Report design · Data viz · Python · Data wrangling · Plotly & Dash · SQL · Forecast & scoring

03 03

Producers' Dashboard

A live, paid workspace where a producer's team decides when and where to release, where to spend promotion money, and how the film is doing after launch.

Live
Paid decision suite
Producers & film teams
Who it is built for
  • Before release: day-one predictions, and a benchmark against the other films opening in the same window (social buzz, trailer engagement, reviews, search interest, cast strength).
  • Trailer and song analytics, and social listening with sentiment on the film.
  • After release: live box office by country and language, then down through state and city to the theatre.
  • Ranked recommendations on where the next rupee of promotion should go. New features are added as producers ask for them.

Forecast & scoring · Python · SQL · Data wrangling · Social analytics · Listening tools · Data viz · Product & project management · Dashboards & BI

See the decision suite on CinemaIP
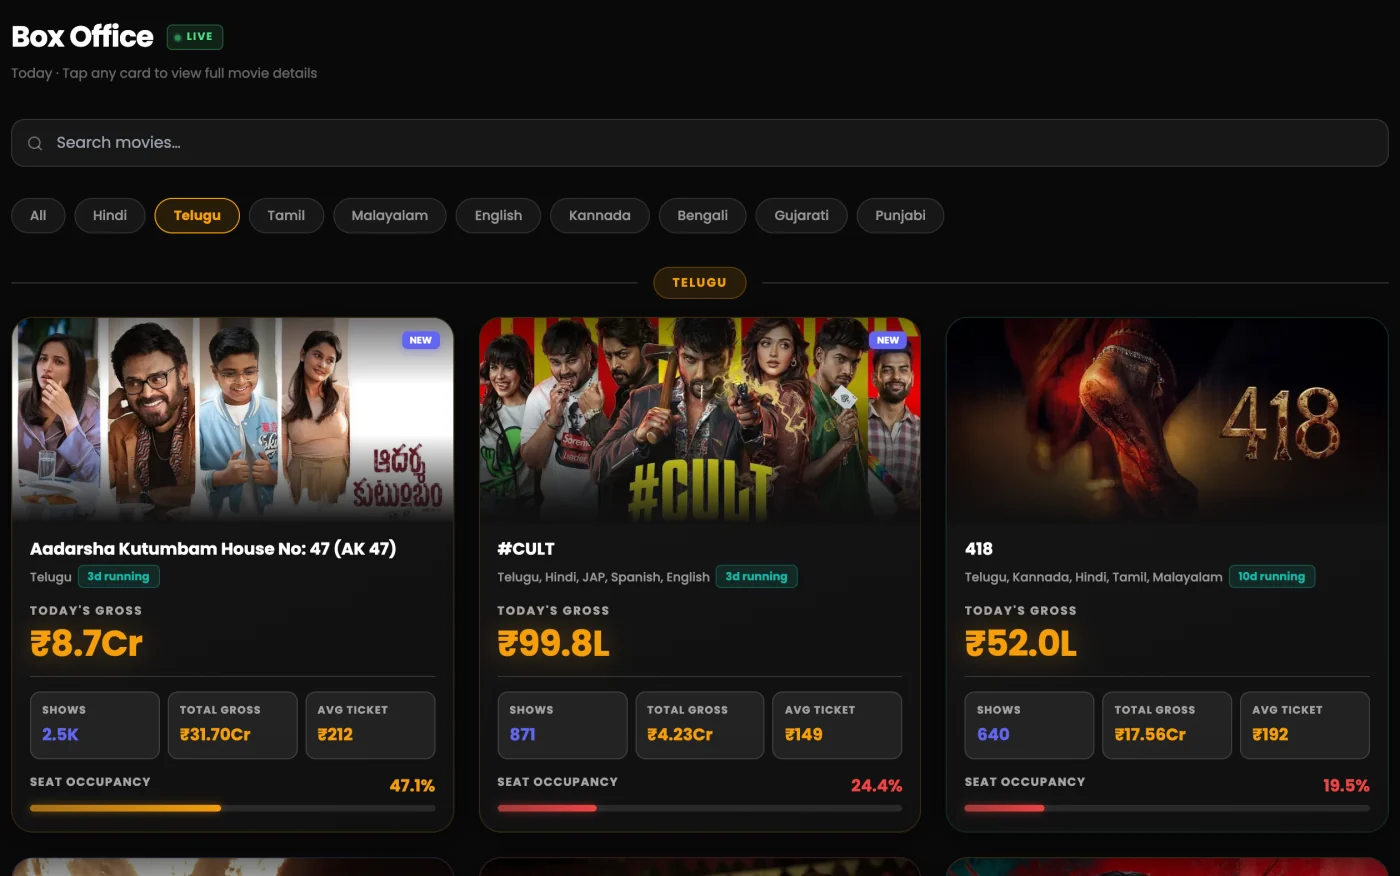
CinemaIP's live Box Office page
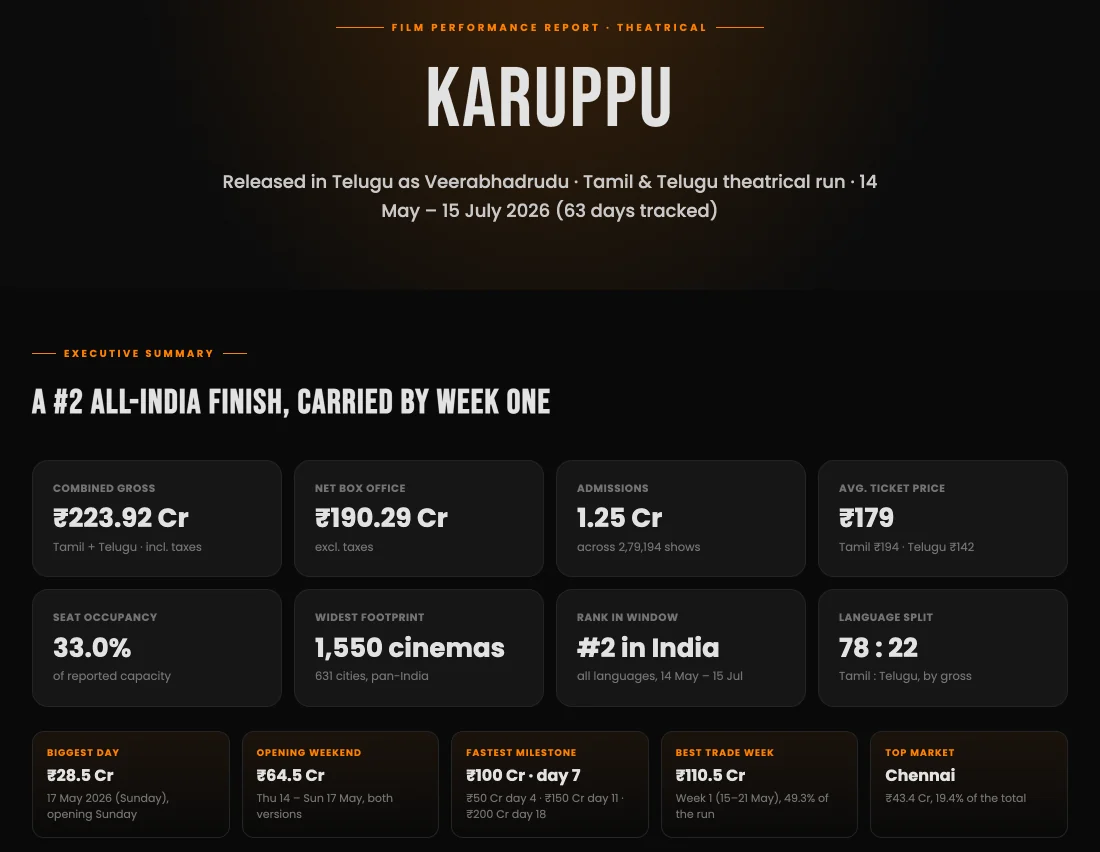
A CinemaIP film report summary
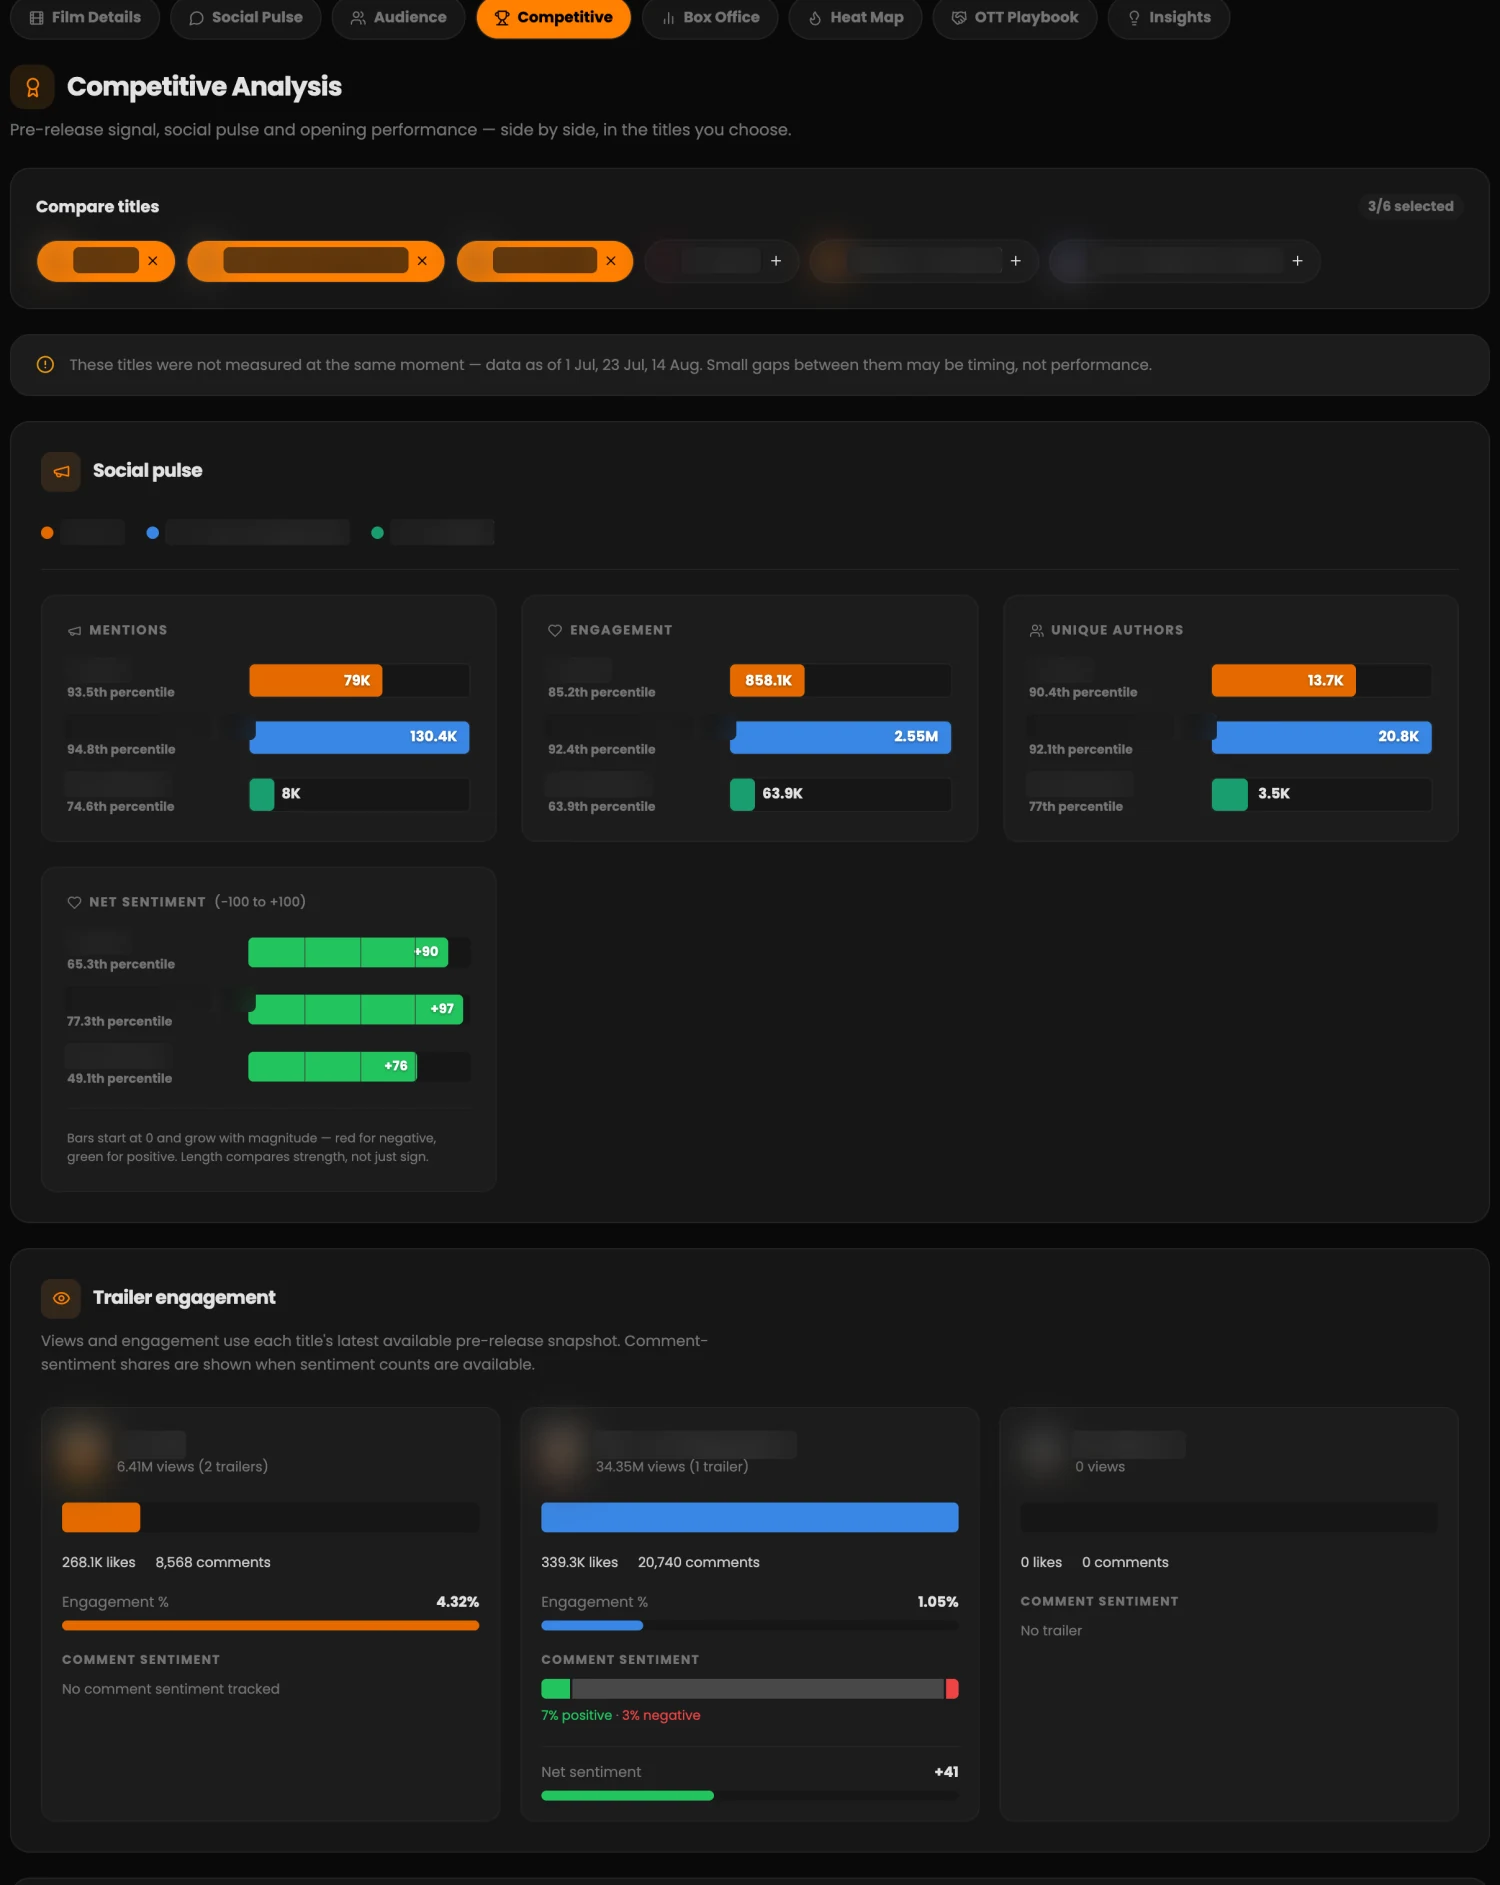
The competitive analysis view of the producers' dashboard: social pulse and trailer engagement for three films side by side. Titles blurred.
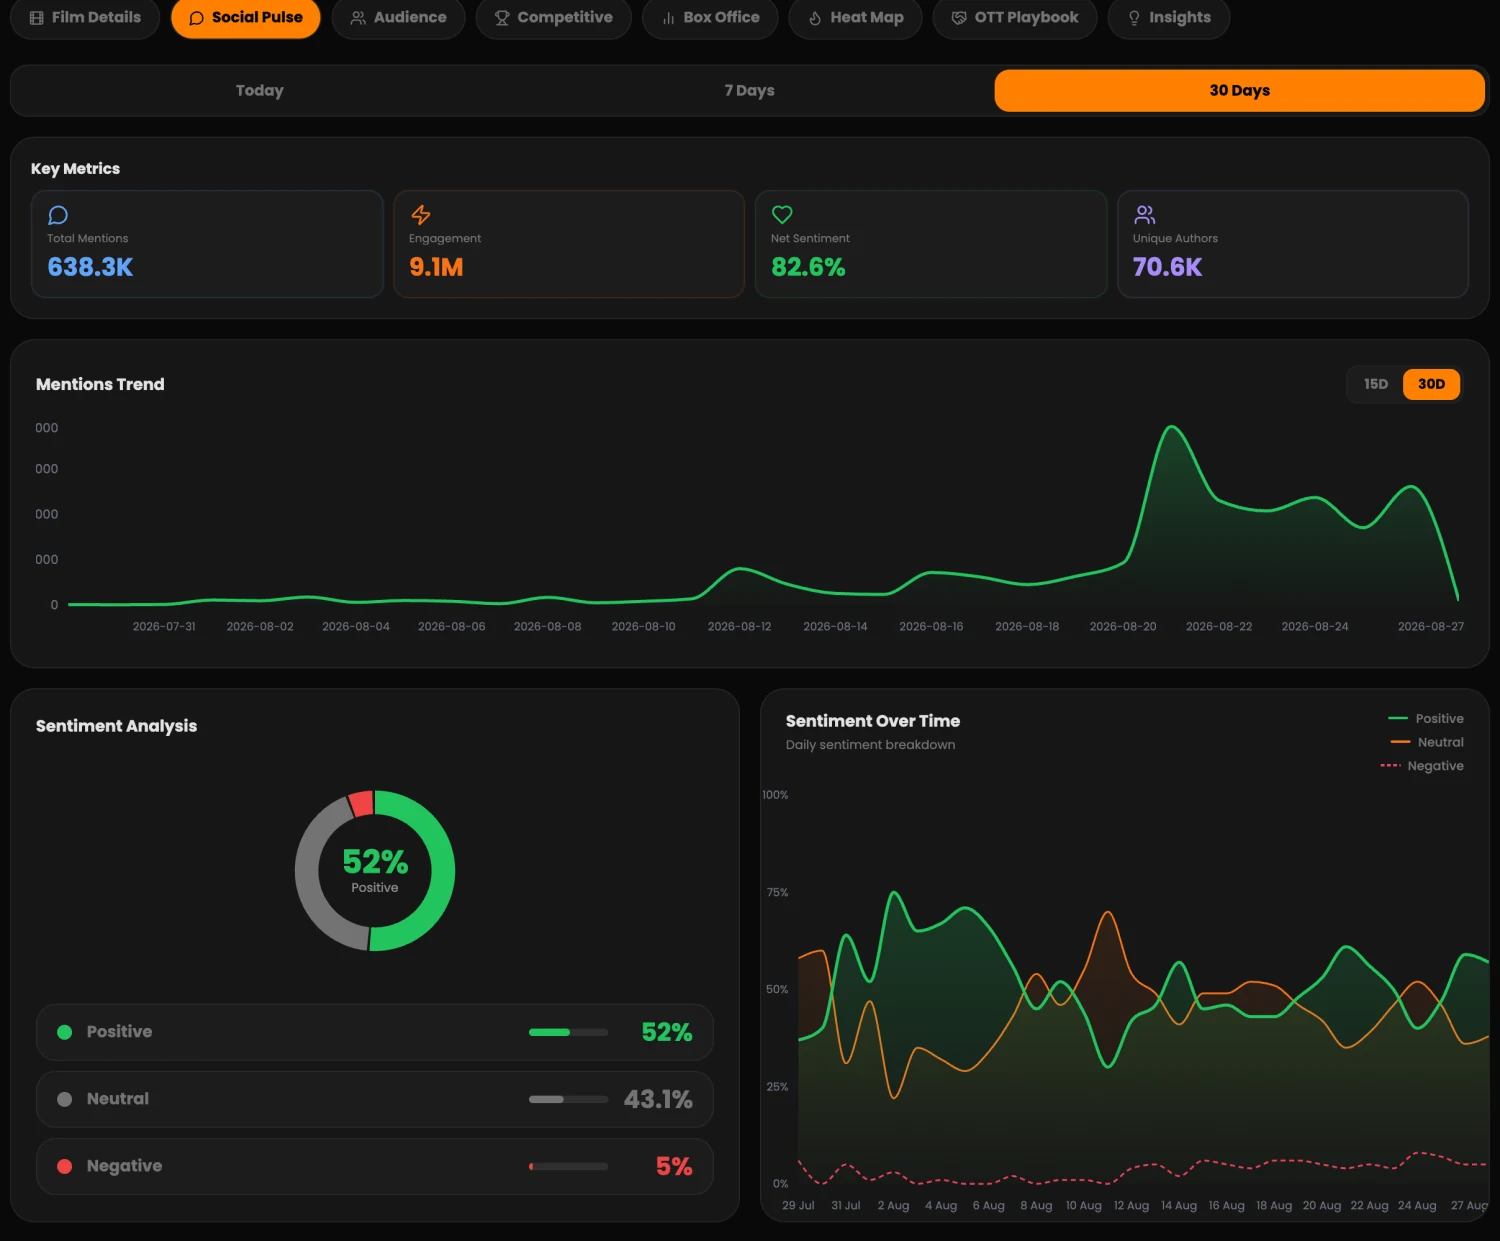
The social pulse view of the producers' dashboard: key metrics, a mentions trend and sentiment analysis over 30 days.
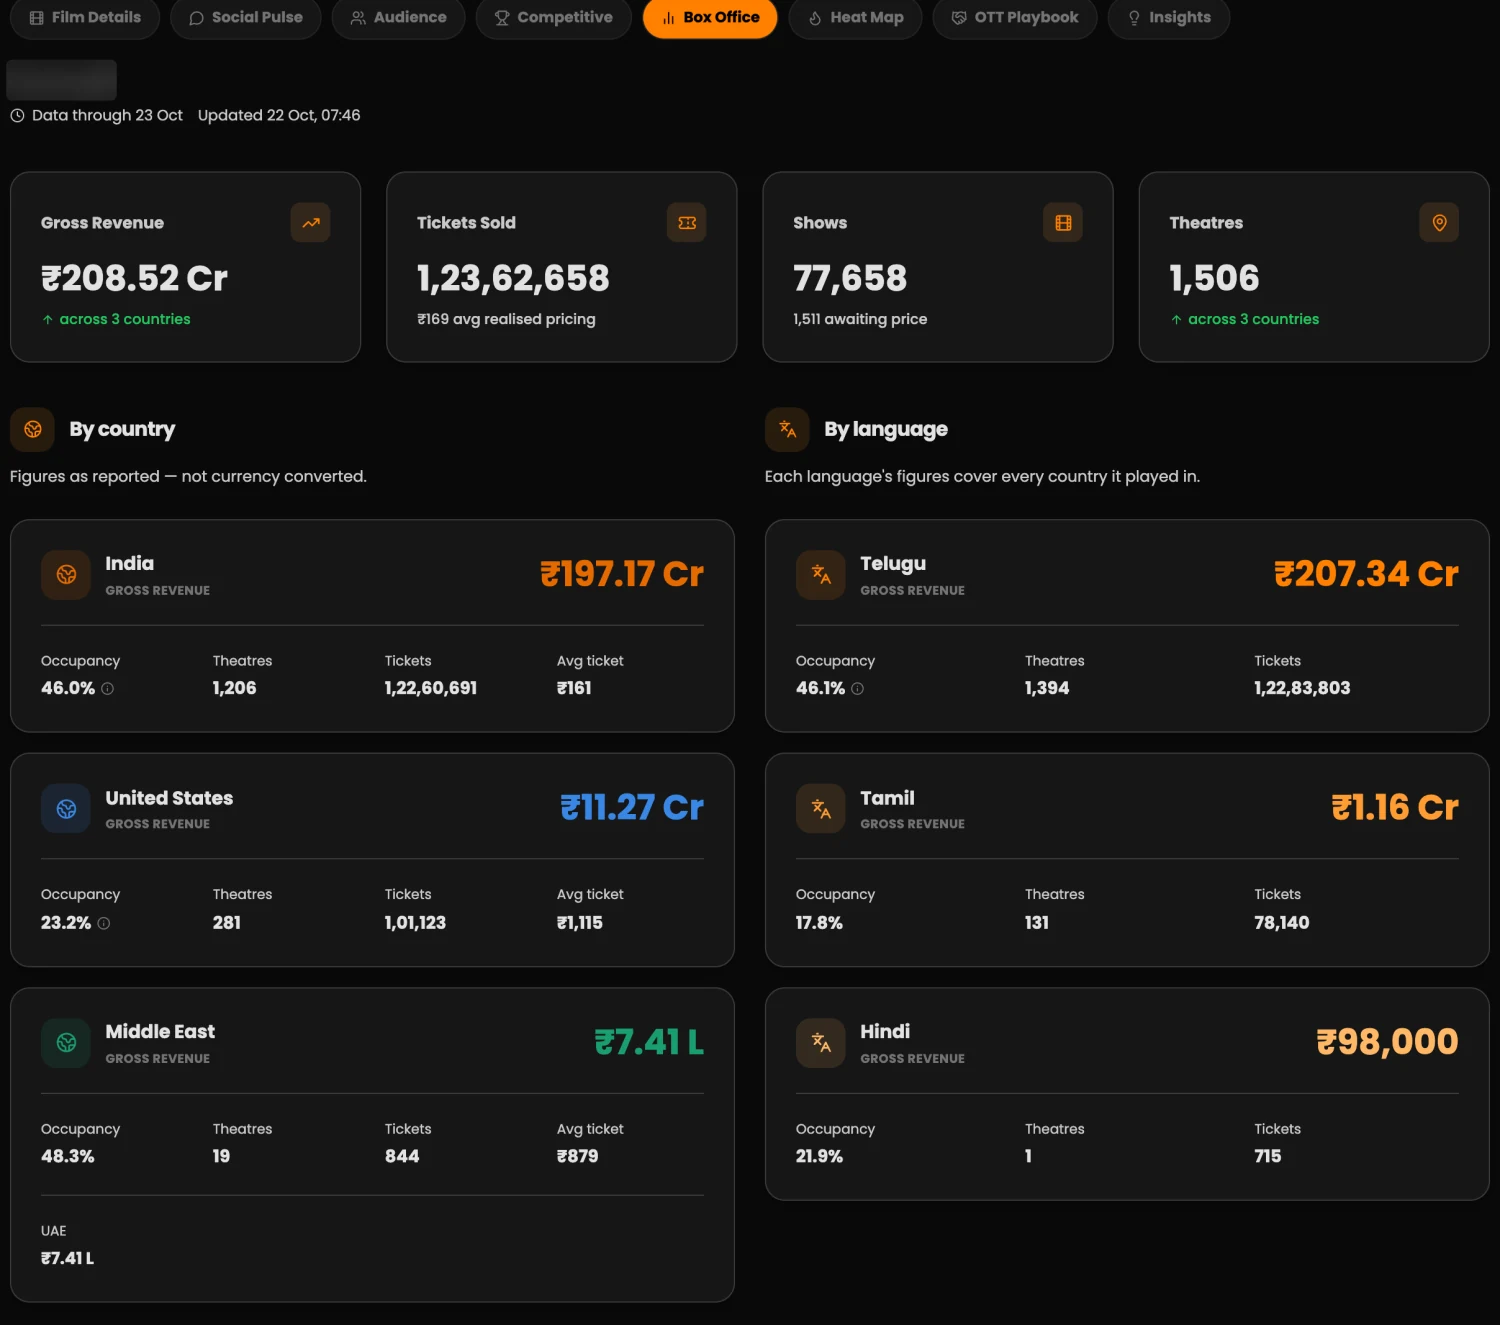
The box office view of the producers' dashboard: gross, tickets, shows and theatres, split by country and by language. Title blurred.
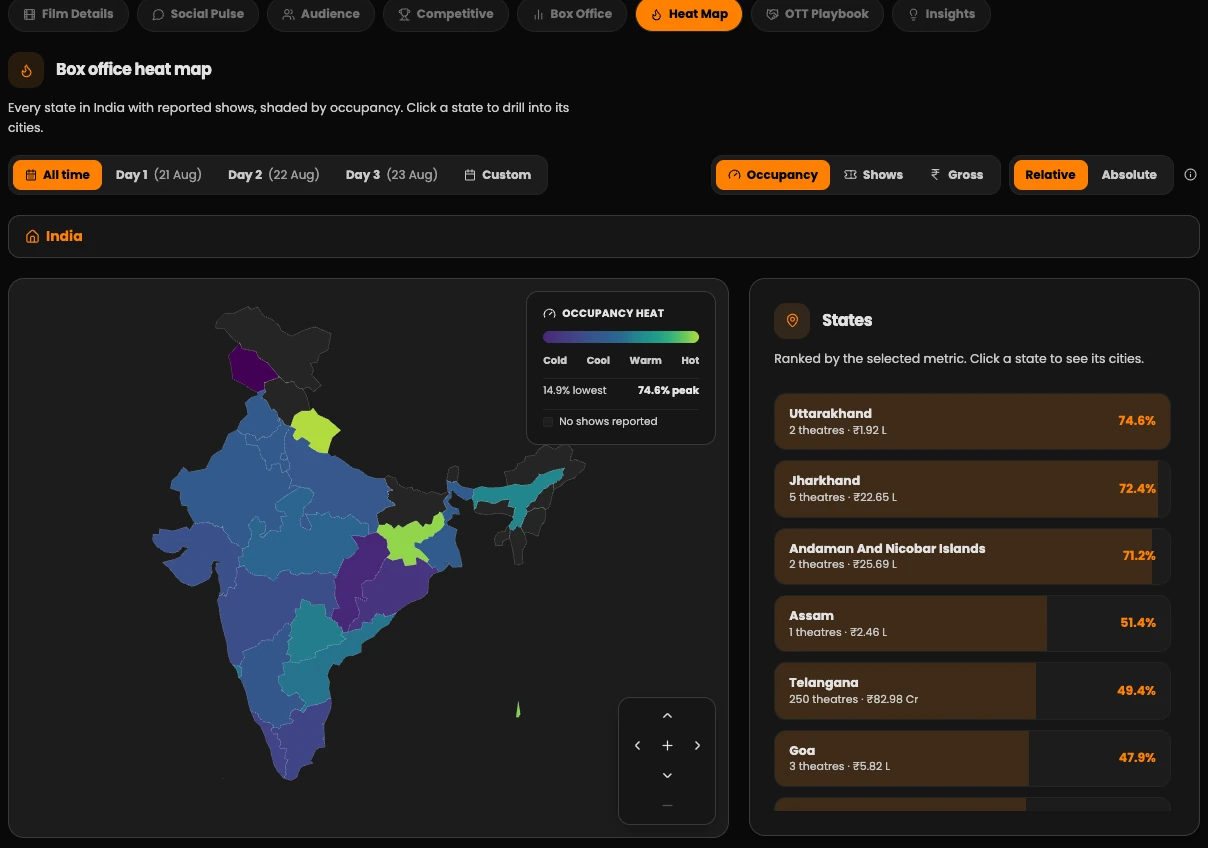
The box office heat map of the producers' dashboard: every Indian state shaded by occupancy, with a ranked list of states.
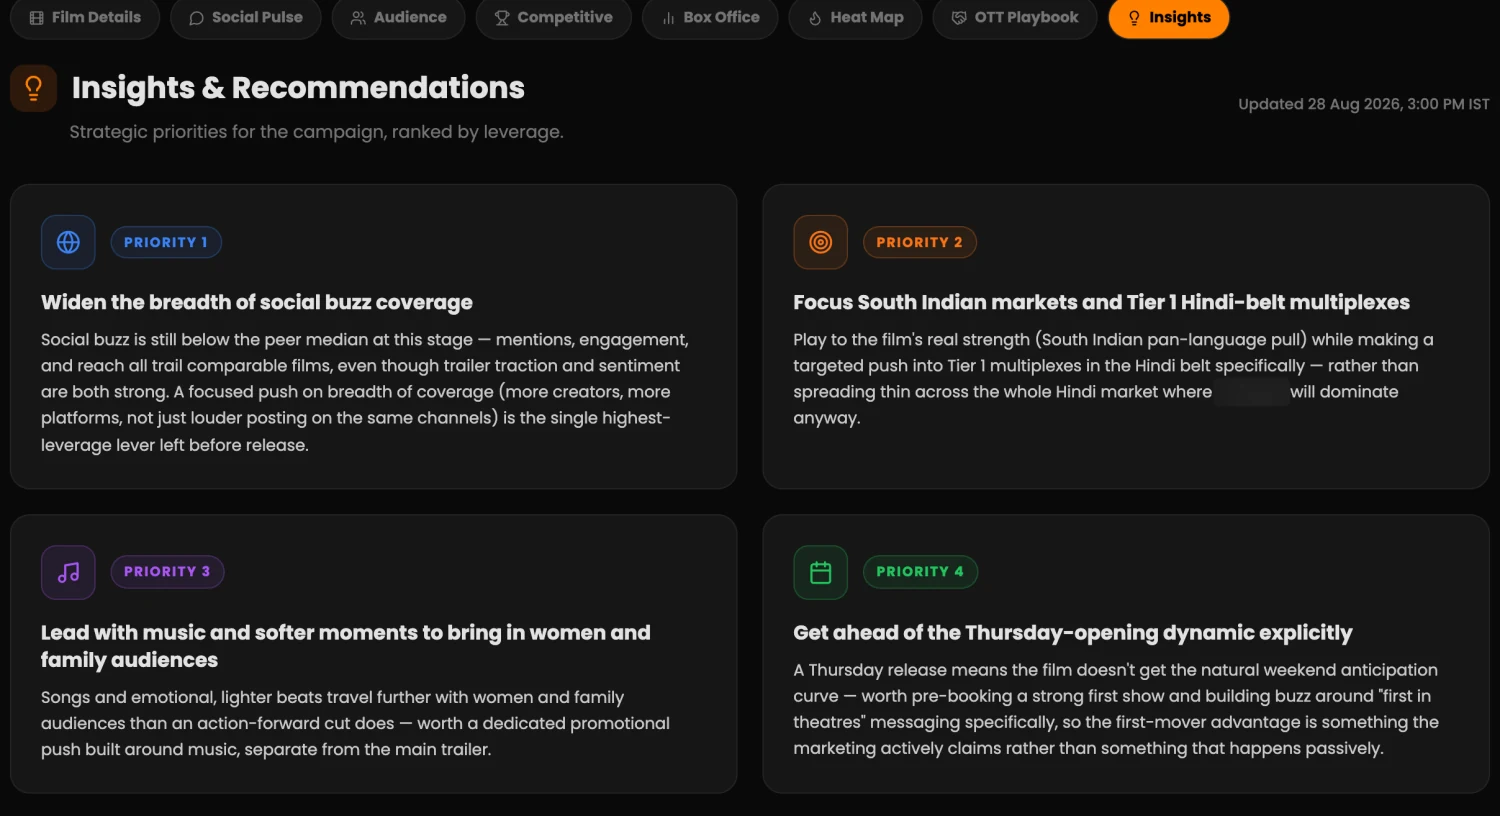
The recommendations view of the producers' dashboard: four ranked strategic priorities for the campaign.

3 of 8

Data analytics and reports

Findings-first benchmark reports for entertainment and politics, on real figures.

Entertainment
movie, theatre and industry box-office reports
39%
growth in India's box office in one quarter
Politics
monthly leader and party social reports
31
leaders in one peer benchmark

What the reports measure

Two domains, one approach: every report opens with its findings, then the numbers, benchmarked against peers. No client names, only the measures.

Entertainment

Reports on films, theatres and the film market.

Box-office reports

Film, theatre and industry, on the hourly data.

  • Gross and admissions
  • Shows, cinemas and cities
  • Seat occupancy
  • Average ticket price
  • Day 1 and opening week
  • Share of the market
  • Territory split
  • Single screen against multiplex
  • Show slot and day of week

Film social listening

Buzz and mood around a release.

  • Mentions
  • Unique authors
  • Engagement
  • Net sentiment
  • Share of voice
  • Platform mix
  • Trending hashtags

Competitor benchmarks

Films opening in the same window.

  • Social buzz
  • Trailer views and engagement
  • Review scores
  • Search interest
  • Cast strength
Politics

Reports on leaders, parties and constituencies.

Social media reports

Monthly, benchmarked against peers.

  • Followers by platform
  • Change against the previous 30 days
  • Posts published
  • Engagement
  • Engagement rate
  • Rank among peers
  • Multiple of the peer median
  • Platform mix
  • Biggest movers

Sentiment

Mood around leaders and constituencies.

  • Sentiment by leader
  • Sentiment by constituency
  • News sentiment
  • Cross-platform comparison

Election reports

Booth and constituency level.

  • Booth score, 0 to 1000
  • Swing and competitive booths
  • Constituency heatmaps

Report 1 of 2

Entertainment

Box-office benchmark

A whole film market, findings first, using CinemaIP's India Box Office Report for Q3 2026 (read the full 22-page report). The report types are in Entertainment.

39%growth in India's box office in one quarter

Read the full 22-page report on CinemaIP ↗

The interactive benchmark needs JavaScript.

Report 2 of 2

Politics

Social media benchmark

The same findings-first approach for politics: the monthly leader and party reports, on real public figures. Who leads, who moved, and how each audience engages.

31leaders in one peer benchmark

The interactive report needs JavaScript.

4 of 8

Political analytics

Eight years of election analytics, from scanned result sheets to a score for every booth. This is client work, so there are no screenshots, but the methods and the numbers are real.

27
KPIs behind each booth's VPAS score
3 of 3
survey forecasts correct
119
Telangana constituencies in one dashboard
100K+
downloads of a state party's app

What I built

Six pieces of work, from scanned result sheets to daily intelligence.

Election analytics

From scanned result sheets to booth-level insight.

  • Form 20 (booth-wise results) read from images with OCR, then analysed booth by booth.
  • Three surveys, one at state level and two at constituency level. All three forecasts were correct.
  • Booth-level and exploratory analysis of elections in five states and territories.

VPAS: Voter Party Affinity Score

G3ODisha's proprietary rating for every booth.

  • One 0 to 1000 score per booth from 27 KPIs: past election results, social media coverage and ground surveys.
  • Finds the swing and competitive booths, so effort goes where it matters.
  • Delivered as an app and automated PDF reports, reusable for any election.

Intelligence platform and dashboards

News, sentiment and maps for every constituency.

  • A dashboard for all 119 Telangana constituencies: news, sentiment (VADER and custom models) and maps, on BigQuery.
  • Map layers built from GIS shapefiles made from scratch.
  • Custom constituency dashboards with heatmaps, handed over as interactive HTML and PDF.

Leaders, parties and their handles

Social media, measured the same way for everyone.

  • Monthly benchmark reports on all Telangana leaders and parties, and on Andhra Pradesh parties and party heads.
  • Data gathered every day from social media and websites, turned into analytics and AI-based recommendations for managing the handles.
  • See the benchmark itself in Data analytics.

Apps, websites and YouTube

The digital side of a campaign.

  • A cadre onboarding app for a political party: members join through the app, building a strong cadre from the grassroots.
  • A state party's official app (100K+ downloads, 43% daily retention) and a volunteer-management app.
  • Two party websites, three news websites (two funded by Google News Initiative) and six YouTube channels: two main channels with 1M+ subscribers each, plus their sub-channels.

Electoral Roll (E-Roll) data pipeline

A technical challenge, solved end to end.

  • E-Roll images read with OCR (Tesseract and Google Cloud Vision) into structured booth-wise voter data.
  • A machine-learning CAPTCHA solver, built to automate the bulk download of those documents.
  • Scaled to constituency level on Google Vertex AI.

From a scanned result sheet to a booth score

How VPAS is produced, step by step.

  1. Collect the sheets

    Booth-wise result sheets (Form 20) and Electoral Rolls (E-Roll) arrive as scanned images and PDFs.

    In Scanned pagesOut Images

  2. Read them with OCR

    Tesseract and Google Cloud Vision turn the images into text and numbers.

    In ImagesOut Raw text and numbers

  3. Structure and check

    Results are cleaned, checked and tied to their booths and constituencies.

    In Raw textOut One clean table per constituency

  4. Bring in the rest

    Past elections, social media coverage and ground-survey data are joined to each booth.

    In Clean tableOut A full profile per booth

  5. Score every booth

    27 KPIs become one 0 to 1000 score, the Voter Party Affinity Score.

    In Booth profileOut VPAS score

  6. Find what matters

    Booths are grouped, including swing and competitive booths.

    In ScoresOut Segments

  7. Deliver

    An app, an interactive dashboard and automated PDF reports.

    In SegmentsOut What the campaign team sees

What I built

Six pieces of work, from scanned result sheets to daily intelligence.

01Election analytics3 of 3 forecasts correct

From scanned result sheets to booth-level insight.

  • Form 20 (booth-wise results) read from images with OCR, then analysed booth by booth.
  • Three surveys, one at state level and two at constituency level. All three forecasts were correct.
  • Booth-level and exploratory analysis of elections in five states and territories.
02VPAS: Voter Party Affinity Score27 KPIs, one 0 to 1000 score

G3ODisha's proprietary rating for every booth.

  • One 0 to 1000 score per booth from 27 KPIs: past election results, social media coverage and ground surveys.
  • Finds the swing and competitive booths, so effort goes where it matters.
  • Delivered as an app and automated PDF reports, reusable for any election.
03Intelligence platform and dashboards119 constituencies

News, sentiment and maps for every constituency.

  • A dashboard for all 119 Telangana constituencies: news, sentiment (VADER and custom models) and maps, on BigQuery.
  • Map layers built from GIS shapefiles made from scratch.
  • Custom constituency dashboards with heatmaps, handed over as interactive HTML and PDF.
04Leaders, parties and their handlesMonthly benchmark reports

Social media, measured the same way for everyone.

  • Monthly benchmark reports on all Telangana leaders and parties, and on Andhra Pradesh parties and party heads.
  • Data gathered every day from social media and websites, turned into analytics and AI-based recommendations for managing the handles.
  • See the benchmark itself in Data analytics.
05Apps, websites and YouTube100K+ app downloads

The digital side of a campaign.

  • A cadre onboarding app for a political party: members join through the app, building a strong cadre from the grassroots.
  • A state party's official app (100K+ downloads, 43% daily retention) and a volunteer-management app.
  • Two party websites, three news websites (two funded by Google News Initiative) and six YouTube channels: two main channels with 1M+ subscribers each, plus their sub-channels.
06Electoral Roll (E-Roll) data pipelineScaled to constituency level

A technical challenge, solved end to end.

  • E-Roll images read with OCR (Tesseract and Google Cloud Vision) into structured booth-wise voter data.
  • A machine-learning CAPTCHA solver, built to automate the bulk download of those documents.
  • Scaled to constituency level on Google Vertex AI.

From a scanned result sheet to a booth score

How VPAS is produced, step by step.

  1. 01

    Collect the sheets

    Booth-wise result sheets (Form 20) and Electoral Rolls (E-Roll) arrive as scanned images and PDFs.

  2. 02

    Read them with OCR

    Tesseract and Google Cloud Vision turn the images into text and numbers.

  3. 03

    Structure and check

    Results are cleaned, checked and tied to their booths and constituencies.

  4. 04

    Bring in the rest

    Past elections, social media coverage and ground-survey data are joined to each booth.

  5. 05

    Score every booth

    27 KPIs become one 0 to 1000 score, the Voter Party Affinity Score.

  6. 06

    Find what matters

    Booths are grouped, including swing and competitive booths.

  7. 07

    Deliver

    An app, an interactive dashboard and automated PDF reports.

5 of 8

Automation, scraping and bots

If it repeats, it runs on a schedule, and something tells me when it stops.

Monitored
health checks on sources and machines
Hourly
box-office refresh
650K+
titles in the movie warehouse
50K+
indexable pages

How the live box-office engine runs

One hour in the life of the data behind CinemaIP.

  1. Split the work

    The theatre list is divided across Google Cloud VMs, so each machine carries a slice.

    In Theatre listOut One slice per machine

  2. Collect every hour

    Cron-scheduled custom scrapers pull show-level data: shows, tickets, occupancy and average ticket price.

    In A sliceOut Raw show data

  3. Clean and check

    Records are de-duplicated, reshaped and validated before anything moves on.

    In Raw show dataOut Validated data

  4. Store

    Cleaned data is synced to the database behind CinemaIP.

    In Validated dataOut One source for the product

  5. Publish

    Live movie pages, reports and the producers' dashboard all read from it.

    In The databaseOut Live pages, reports, dashboard

  6. Watch it, all the time

    Health checks flag a source or a machine that stopped reporting, so gaps are noticed early.

    In Every runOut An alert, not a surprise

What runs, and how often

A typical week. Jobs are scheduled and orchestrated; the benchmark reports are built to run whenever a client asks.

JobMonTueWedThuFriSatSun
Box-office collectionHourly
Trailers and teasersDaily
News draftsDaily
Social media and website data for political clientsDaily
Benchmark reportsWhen required

What I built

Five pieces of automation, from the schedulers to the scripts.

Pipelines and orchestration

Automated from the first line, not retro-fitted.

  • Pipelines are scheduled and orchestrated by design, with health checks that flag gaps.
  • Cron-scheduled jobs on Google Cloud VMs, with Cloud SQL behind them.
  • Covers box office, trailers and teasers, news drafts, reports and the political data collection.

Custom scrapers

Built for each project, not taken off the shelf.

  • Custom scrapers collect the data for every module and project I have worked on.
  • Headless-browser automation (Selenium) where a page needs a real browser.
  • In use in every role since 2018.

Social media automation

Engagement and messaging, scripted.

  • Custom scripts that increase engagement on social media.
  • WhatsApp bulk messaging for campaign communications.
  • Automated scraping of competitors' social media handles, to see how they perform.

SEO and web performance

Making 50K+ pages findable and fast.

  • Sitemaps for 50K+ indexable pages.
  • Core Web Vitals, so pages load fast and stay stable.
  • Google Analytics (GA4) and Google Search Console, to see what readers do and how Google sees the pages.

OCR and CAPTCHA

Turning images and scans into data.

  • OCR (Tesseract and Google Cloud Vision) reads scanned documents into structured data.
  • A machine-learning CAPTCHA solver, built to automate bulk downloads.
  • Both were built for the Electoral Roll (E-Roll) work. See the pipeline in Politics.
Open Politics

What I built

Five pieces of automation, from the schedulers to the scripts.

  1. 01

    Pipelines and orchestration

    Automated from the first line, not retro-fitted.

    • Pipelines are scheduled and orchestrated by design, with health checks that flag gaps.
    • Cron-scheduled jobs on Google Cloud VMs, with Cloud SQL behind them.
    • Covers box office, trailers and teasers, news drafts, reports and the political data collection.
  2. 02

    Custom scrapers

    Built for each project, not taken off the shelf.

    • Custom scrapers collect the data for every module and project I have worked on.
    • Headless-browser automation (Selenium) where a page needs a real browser.
    • In use in every role since 2018.
  3. 03

    Social media automation

    Engagement and messaging, scripted.

    • Custom scripts that increase engagement on social media.
    • WhatsApp bulk messaging for campaign communications.
    • Automated scraping of competitors' social media handles, to see how they perform.
  4. 04

    SEO and web performance

    Making 50K+ pages findable and fast.

    • Sitemaps for 50K+ indexable pages.
    • Core Web Vitals, so pages load fast and stay stable.
    • Google Analytics (GA4) and Google Search Console, to see what readers do and how Google sees the pages.
  5. 05

    OCR and CAPTCHA

    Turning images and scans into data.

    • OCR (Tesseract and Google Cloud Vision) reads scanned documents into structured data.
    • A machine-learning CAPTCHA solver, built to automate bulk downloads.
    • Both were built for the Electoral Roll (E-Roll) work. See the pipeline in Politics.
    Open Politics

The toolbox

13 tools, in the order the data travels.

Collect

Getting the data

  • PythonPipelines, scrapers and reports
  • SeleniumDrives a real browser for pages that need one
  • PlaywrightA second browser-automation toolkit
  • TesseractReads text from images
  • Google Cloud VisionReads text from images at scale

Run

Making it happen on time

  • cronSchedules every job
  • Google Cloud VMsWhere the scheduled jobs run
  • DockerContainers

Store

Keeping it

  • Cloud SQLRelational database
  • BigQueryAnalytics warehouse

Understand

Making sense of it

  • Vertex AIMachine learning on Google Cloud
  • GeminiDrafts news stories from box-office data
  • ClaudeCoding, analysis, building and research, every day

6 of 8

All projects

21 projects across four domains. Tap one to open its case file.

21
projects
4
domains
3
organisations
8+
years of work

7 of 8

Skills, by kind of work

What I work with, grouped by kind of work. Pick an area to see which skills it draws on.

41
skills and tools
4
areas of work
3
organisations
8+
years of work
Highlight

Data & AI

13
  • Python
  • Data wrangling
  • SQL
  • Stats & sentiment
  • Forecast & scoring
  • Excel
  • Gemini & LLMs
  • OCR
  • BigQuery
  • Vertex AI
  • Claude API & MCP
  • AI agents
  • AI-assisted development

Collection & cloud

11
  • Web scraping
  • Data collection
  • Automation
  • Browser automation
  • CAPTCHA solving
  • Scheduling & monitoring
  • Cloud VMs & batch
  • Google Cloud
  • Docker
  • FastAPI & Postgres
  • Cloud SQL

Social & growth

7
  • Social analytics
  • Listening tools
  • SEO
  • Google Analytics (GA4)
  • Google Search Console
  • YouTube analytics
  • Social media automation

Reporting & building

7
  • Data viz
  • Report design
  • Dashboards & BI
  • Streamlit
  • Plotly & Dash
  • React & Next.js
  • GIS & mapping

Leading

3
  • Team leadership
  • Product & project management
  • Documentation & client delivery

8 of 8

The stock market, as a data problem

What I do for fun: ask the market questions, and let the data answer.

Outside work

I like questions that data can settle. The stock market is full of them: does a pattern really repeat, or did it only look that way?

It is a hobby that has grown into a small research lab of my own: pipelines that collect public exchange data, a way of testing ideas honestly, and a dashboard I check every evening.

The same job, on a different dataset

Collect, clean, test, watch and show: how I work at my job, pointed at the market.

  1. Collect

    Public exchange files and announcements: prices, options and futures, corporate actions, index changes and surveillance lists.

  2. Clean

    Adjust for splits and bonuses, keep the companies that were later delisted, and check every file for gaps before trusting it.

  3. Test

    Write the rules first, keep part of the data locked away, and ask the result to repeat in another period and after costs.

  4. Watch

    Ideas that hold up run live on a paper ledger, where they cannot be fitted after the fact.

  5. Show

    A dashboard I built, refreshed every evening after the market closes.

What I look at

Each one starts as a plain question.

Price patterns

When a stock returns to its long-term average, does it behave differently afterwards?

Momentum and calm stocks

Do last year's winners keep winning, and do quieter stocks hold up better?

Following live, on paper

Options and futures

What do positions in derivatives say about what happens next?

Results days

How do stocks behave around earnings announcements?

Exchange lists and index changes

What happens when a stock goes on a surveillance list, or joins or leaves an index?

Bonus issues

Does a bonus issue leave a trace in the share price?

On paper, waiting for live data

Big moves and who is buying

How do stocks behave after an unusually large day, and does delivery share show who is buying?

Inside the day

Minute by minute: gaps at the open, and what expiry days do.

A couple of ideas are being followed live, on paper. The rest taught me what not to believe.

What I have learned

The useful part of a hobby is what it teaches.

Costs and fresh data

Most patterns fade

A pattern that looks convincing on a chart often disappears once trading costs and unseen data are counted.

Honest answers

No edge is an answer

Writing down that there is nothing here is part of the work, and it stops me fooling myself later.

Clean data

Bugs fool you more than markets do

A date-format bug and a look-ahead bug each produced results that looked real. Finding them mattered more than any model.

The dashboard I built for it

It refreshes by itself every evening after the market closes. Each screen answers one question.

Watchlist Stocks that are close to a signal, so I can see what is coming and not only what has happened.

Signal tracker Does the signal work? It follows every candidate with no money involved.

Paper ledgers Practice portfolios, one per idea, that started with no memory of the backtest.

New strategies Ideas on trial, each on its own paper ledger.

Edge health Is an idea's edge holding or fading? It shows how it behaved in different market conditions.

Daily summary One short digest per trading day, kept so I can look back at what I knew at the time.

News Plain headlines for the stocks on the list. No automated summaries, on purpose.

  • Python
  • pandas
  • NumPy
  • SciPy
  • TypeScript
  • React
  • Express
  • Scheduled daily jobs
  • GitHub Actions

What I have learned

The useful part of a hobby is what it teaches.

Costs and fresh data

Most patterns fade

A pattern that looks convincing on a chart often disappears once trading costs and unseen data are counted.

Honest answers

No edge is an answer

Writing down that there is nothing here is part of the work, and it stops me fooling myself later.

Clean data

Bugs fool you more than markets do

A date-format bug and a look-ahead bug each produced results that looked real. Finding them mattered more than any model.

01What I look at8 questions

Each one starts as a plain question.

Price patterns

When a stock returns to its long-term average, does it behave differently afterwards?

Momentum and calm stocks

Do last year's winners keep winning, and do quieter stocks hold up better?

Following live, on paper

Options and futures

What do positions in derivatives say about what happens next?

Results days

How do stocks behave around earnings announcements?

Exchange lists and index changes

What happens when a stock goes on a surveillance list, or joins or leaves an index?

Bonus issues

Does a bonus issue leave a trace in the share price?

On paper, waiting for live data

Big moves and who is buying

How do stocks behave after an unusually large day, and does delivery share show who is buying?

Inside the day

Minute by minute: gaps at the open, and what expiry days do.

A couple of ideas are being followed live, on paper. The rest taught me what not to believe.

02The same job, on a different dataset5 steps

Collect, clean, test, watch and show: how I work at my job, pointed at the market.

  1. Collect

    Public exchange files and announcements: prices, options and futures, corporate actions, index changes and surveillance lists.

  2. Clean

    Adjust for splits and bonuses, keep the companies that were later delisted, and check every file for gaps before trusting it.

  3. Test

    Write the rules first, keep part of the data locked away, and ask the result to repeat in another period and after costs.

  4. Watch

    Ideas that hold up run live on a paper ledger, where they cannot be fitted after the fact.

  5. Show

    A dashboard I built, refreshed every evening after the market closes.

03The dashboard I built for it7 screens

It refreshes by itself every evening after the market closes. Each screen answers one question.

Watchlist Stocks that are close to a signal, so I can see what is coming and not only what has happened.

Signal tracker Does the signal work? It follows every candidate with no money involved.

Paper ledgers Practice portfolios, one per idea, that started with no memory of the backtest.

New strategies Ideas on trial, each on its own paper ledger.

Edge health Is an idea's edge holding or fading? It shows how it behaved in different market conditions.

Daily summary One short digest per trading day, kept so I can look back at what I knew at the time.

News Plain headlines for the stocks on the list. No automated summaries, on purpose.

Can you spot the real edge?

A small game about luck and skill. Twelve trading ideas, one of them real.

Personal research on public exchange data, paper trading only. Not investment advice, and no securities are recommended.

Open to full-time roles

The fastest way is email or a call. Tap to open it, or copy it.

Emailsrikarchanty20@gmail.com
Phone+91 85559 64834
Call

Hyderabad, India